Key indicators
Start the day at the problems
Every tile and chip is a count that opens exactly the work behind it - missed clocks, shifts not finalised, schedules nobody has confirmed.
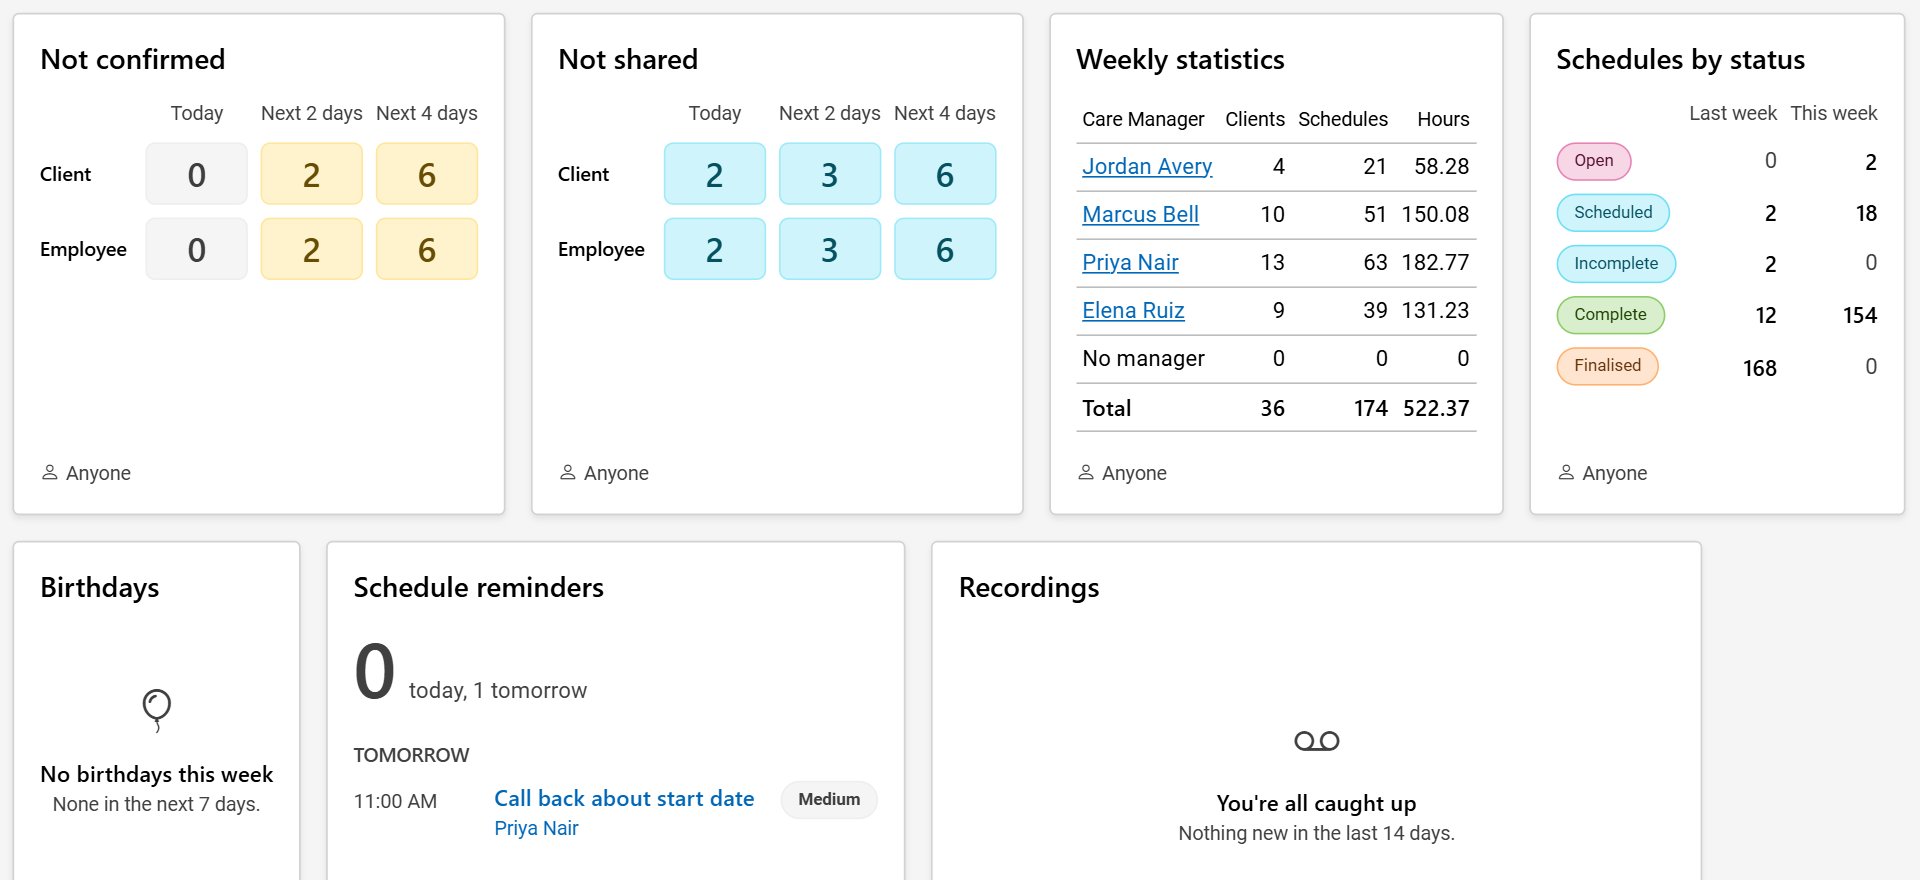
Counts for today and the next few days, each one a link.
Reports tell you what went wrong last month. CareComplete's dashboard tells you what needs doing now. Every number on it is a link: click a care manager's unconfirmed schedules and you land on the schedule board, filtered to exactly those shifts.
Exceptions, not lists
Timesheets sort themselves into what is ready to finalise and what needs attention: missing approved times, missed clock-ins and clock-outs, open red flags, and earlier weeks still outstanding. The office works through the problems instead of reading every row.
Per care manager, per week
Weekly statistics show each care manager's clients, schedules and hours this week, and overtime and windshield time are counted as the week goes. Each tile is set to the office or caseload its reader looks after.
- A dashboard each person arranges for their own day
- Open shifts, missed clocks and shifts not yet finalised
- Schedules not confirmed or not shared, for today and the days ahead
- Weekly statistics per care manager: clients, schedules and hours
- Overtime and windshield time for the week so far
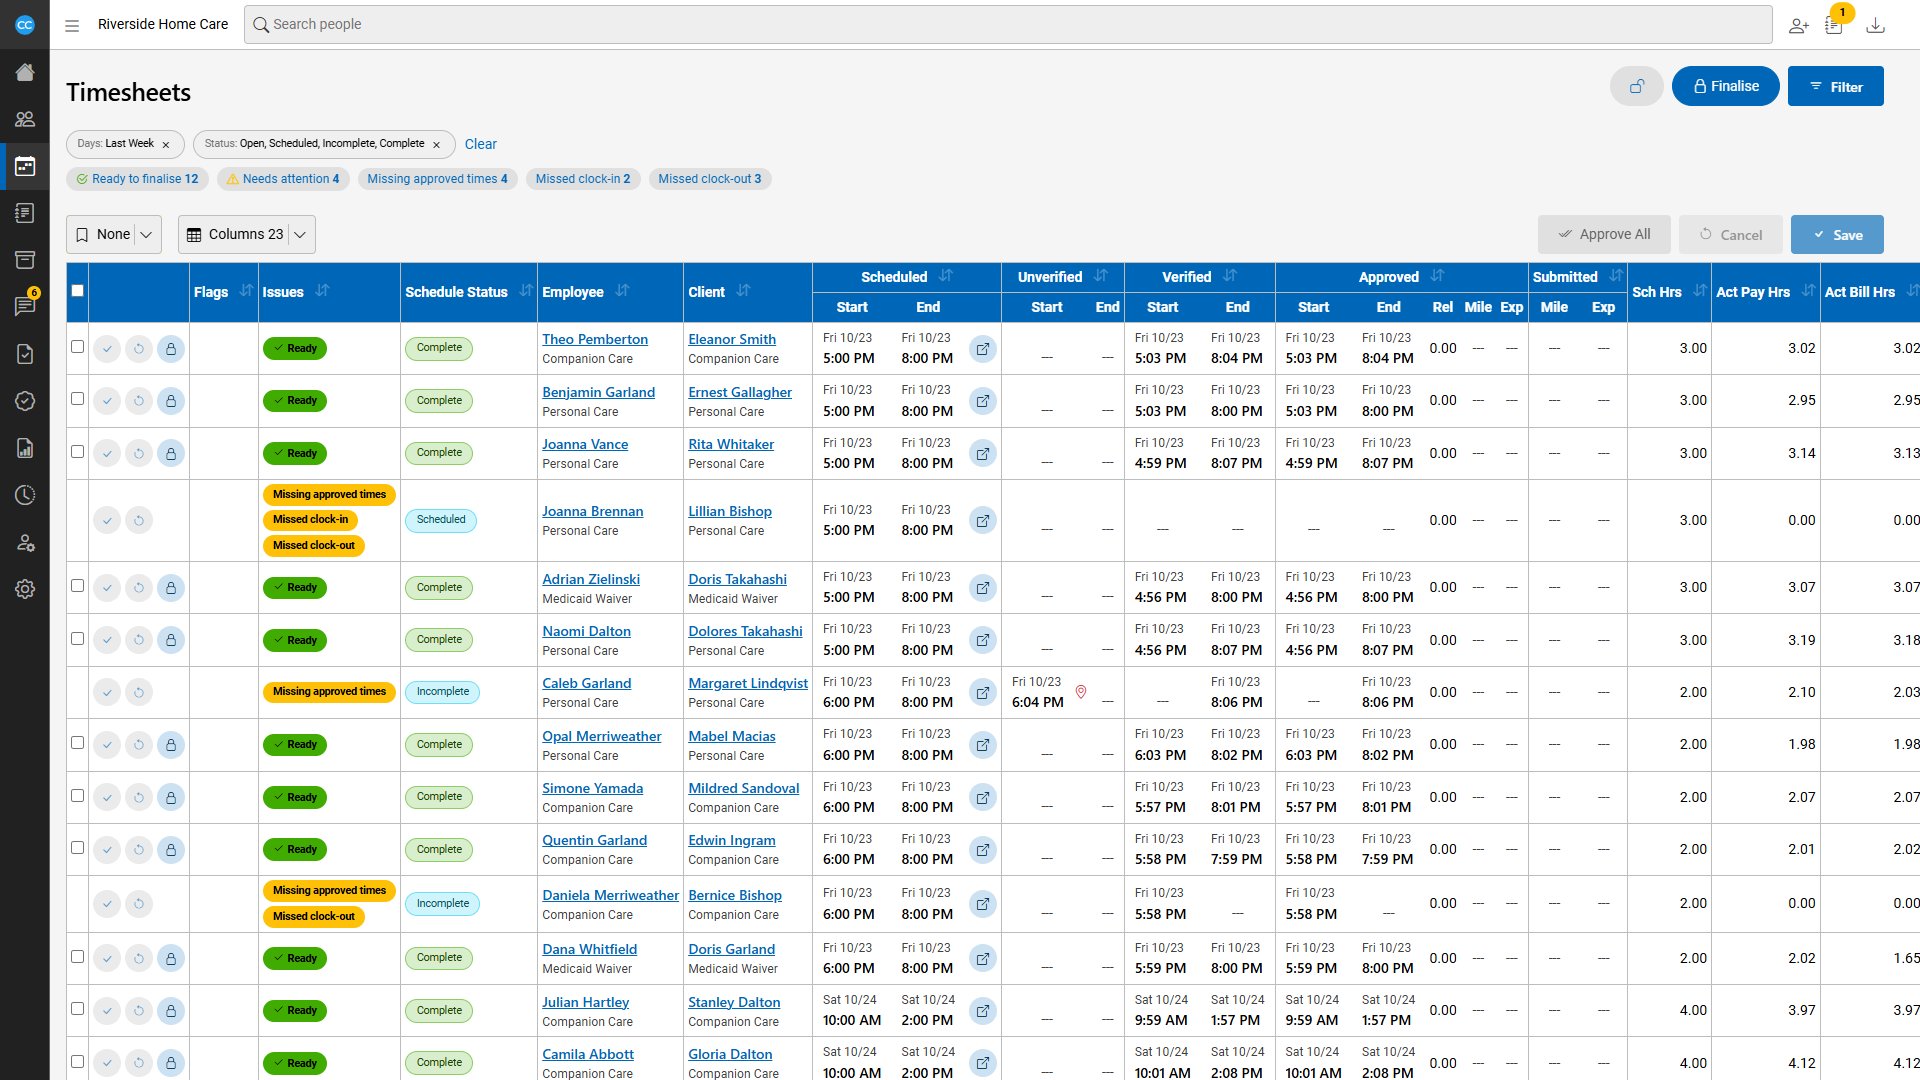
Timesheets sorted into what is ready and what needs attention.